S&P 500 Hits a Record With the 10-Year Above 5%: Earnings, Not Liquidity, Is Doing the Lifting
The rule that high rates weigh on stocks has not broken. AI capex and profit growth are simply moving faster than the discount-rate burden. The margin for error is nearly gone.
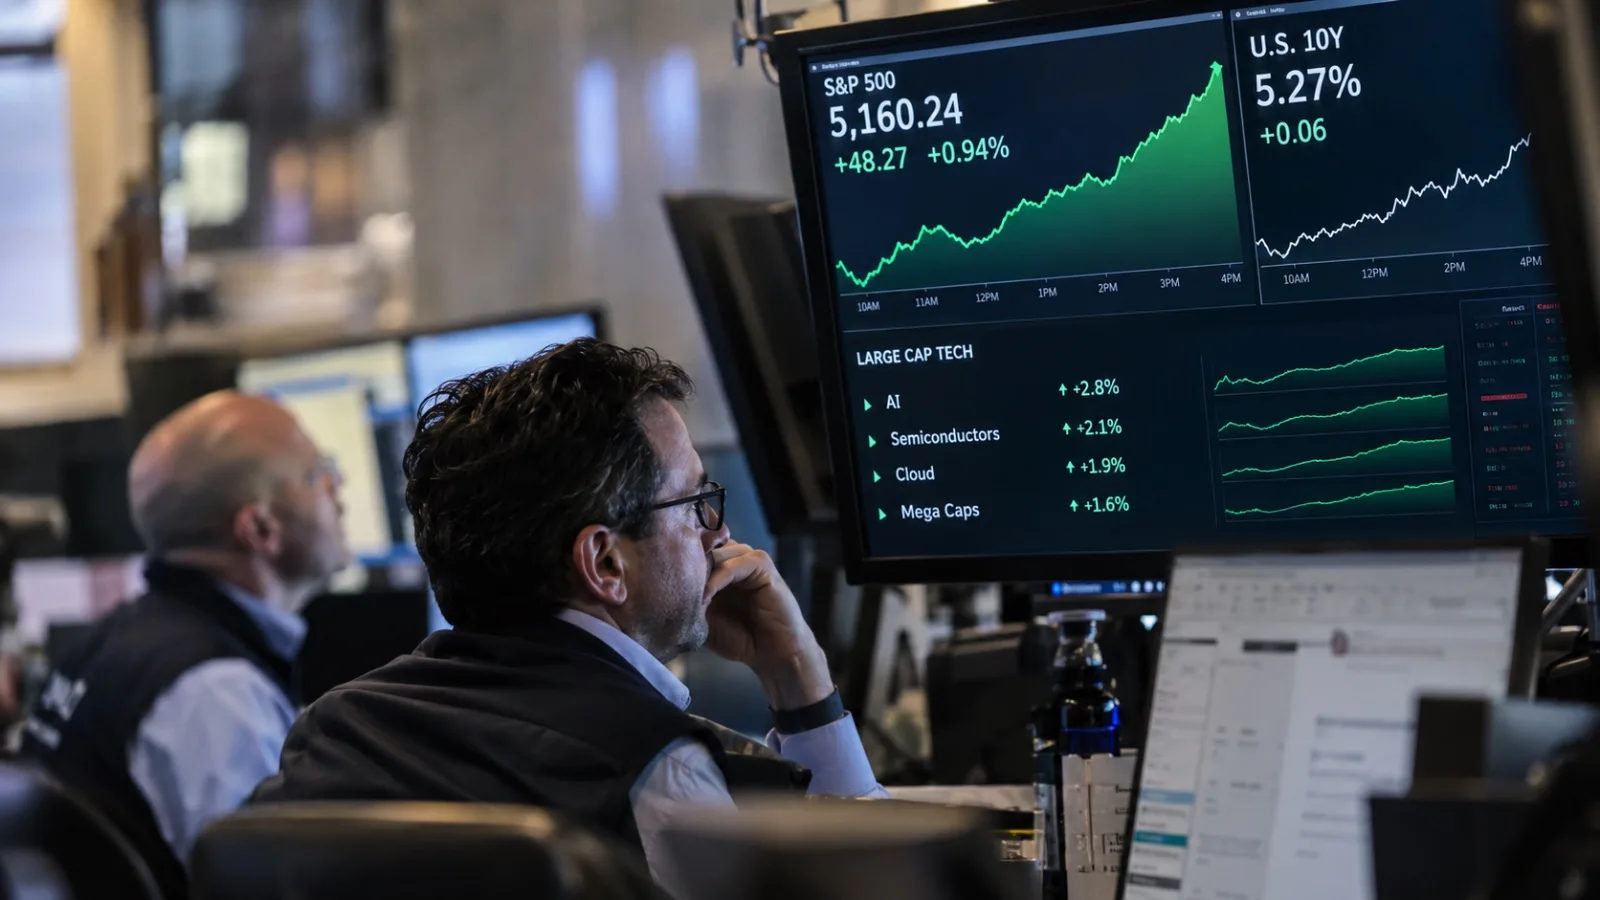
The record is not about multiple expansion
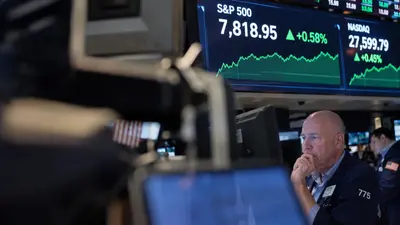
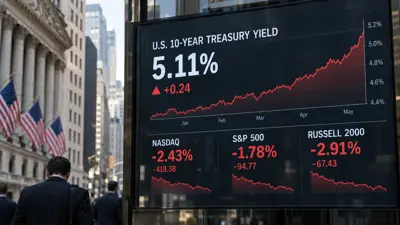
The S&P 500 closed at a record 7,818.93 on Oct. 6. The Nasdaq also set a high. The 10-year Treasury yield that day was about 5.27%. The day before, it had climbed to 5.31%, the highest since 2002.
Higher long-term yields usually cut the present value of growth stocks. This time, earnings forecasts are rising faster on the other side of the ledger. FactSet expects third-quarter S&P 500 EPS to grow 29.5% from a year earlier. For information technology, the expected growth is 65.0%. Of 116 companies, 72 issued EPS guidance above market expectations, the highest share since FactSet began tracking the data.
- +29.5%: expected Q3 S&P 500 EPS growth
- +65.0%: expected Q3 information technology EPS growth
- 19x: S&P 500 forward P/E
AI capex has moved from story to results
The 2026 consensus for US hyperscaler capex is about $800 billion. Goldman Sachs estimates global AI-related investment will top $1 trillion this year. Forecasts for 2027 hyperscaler capex range from about $900 billion to more than $1.2 trillion, depending on the definition used. The direction is the same: AI spending is still expanding rather than slowing.
The money does not stop at GPUs and HBM memory. It flows into revenue for networking, cooling, power, data center construction, industrial equipment and cloud services. Goldman says beneficiaries of AI data center investment could account for about half of S&P 500 earnings growth in 2026 and 2027.
To read this market, the first question is less "are rates high?" than "are EPS upgrades outpacing the rise in yields?"
The nature of long-term yields matters more than the Fed
September payrolls rose by only 29,000 and the unemployment rate climbed to 4.2%. That sharply reduced the odds of another rate hike in October. The market is treating short-term policy rates and long-term yields separately.
| Variable | How the market reads it | Effect on stocks |
|---|---|---|
| Fed policy rate | Risk of back-to-back October hikes has eased | Eases near-term discount-rate shock |
| 10-year yield | Driven by fiscal policy, Treasury supply, oil prices and term premium | Caps valuations |
| Corporate earnings | Upgrades continue, led by AI | Offsets the burden of high rates |
Beneath the highs, the market is weaker
The index remains heavily dependent on megacaps and AI-linked stocks. The equal-weighted S&P 500 is lagging the cap-weighted index by a wide margin. One tally finds more than 40% of S&P 500 members are down 20% or more from their 52-week highs.
That is not automatically a bearish signal. Both directions remain open. If earnings at the AI leaders falter, index losses could build quickly. If earnings upgrades spread to industrials, power, financials and software, rotation could become the index's next driver.
The key number: 5.26% vs. 5.27%
With the S&P 500 forward P/E at 19, the earnings yield is about 5.26%. That is effectively the same as the roughly 5.27% 10-year Treasury yield.
1 ÷ 19 = 5.26%
Stocks are not holding up because they are cheap. Their valuation rests closer to confidence in future earnings growth.
If earnings estimates hold, the market can likely withstand yields in the 5% range. If AI revenue or margin guidance is cut, EPS and the P/E could fall together, a double compression.
Wall Street's year-end targets are already close
Reuters compiled major brokerage targets on Oct. 6, ranging from 7,400 to 8,100. Goldman Sachs, Morgan Stanley, JPMorgan and Deutsche Bank, among others, see 8,000. UBS, Citi, HSBC and Oppenheimer see 8,100. BofA is the most conservative at 7,400.
| Target | Firms | vs. 7,818.93 |
|---|---|---|
| 8,100 | UBS, Citi, HSBC, Oppenheimer | about +3.6% |
| 8,000 | Goldman, Morgan Stanley, JPMorgan, Deutsche Bank and others | about +2.3% |
| 7,400 | BofA | about -5.4% |
The base case on the Street is less "the bull market is over" than "the index offers limited additional return by year-end." By contrast, FactSet's bottom-up 12-month target, summing individual stock price targets, was far higher at 9,275.04 as of Sept. 24. The wide gap between strategists' index targets and analysts' bottom-up targets is itself a feature of this market.
Insight Times Editorial Desk