Tech Selloff: Is the Bull Market Over? Wall Street's Four-Year Chart Says Not Yet
The uptrend has survived five double-digit pullbacks in four years. This time, AI companies' debt and cash flow are the new variables.
1. Why Wall Street's chart says the bull market isn't over
U.S. tech stocks shook hard last week. The huge cost of AI infrastructure and mounting debt put pressure on chipmakers and cloud companies, which drew heavy selling.
But numbers from Keith Lerner, chief market strategist at Truist, offer another angle.
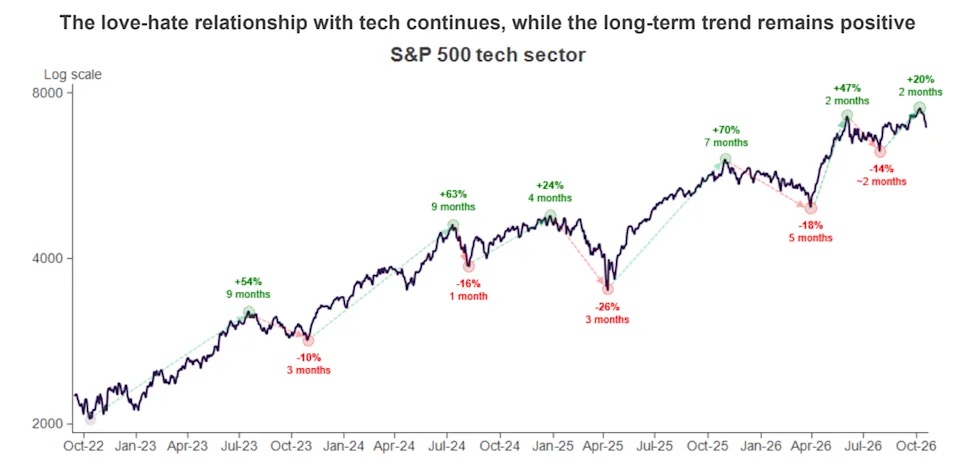
In the bull market that began in October 2022, the S&P 500 technology sector fell more than 6% over five trading days on 12 occasions. It had five double-digit corrections, ranging from 10% to 26%. Semiconductors fell more than 15% over ten trading days five times.
Key statistics: tech down more than 6% in five trading days, 12 times. Tech double-digit corrections, 5. Semiconductors down more than 15% in ten trading days, 5.
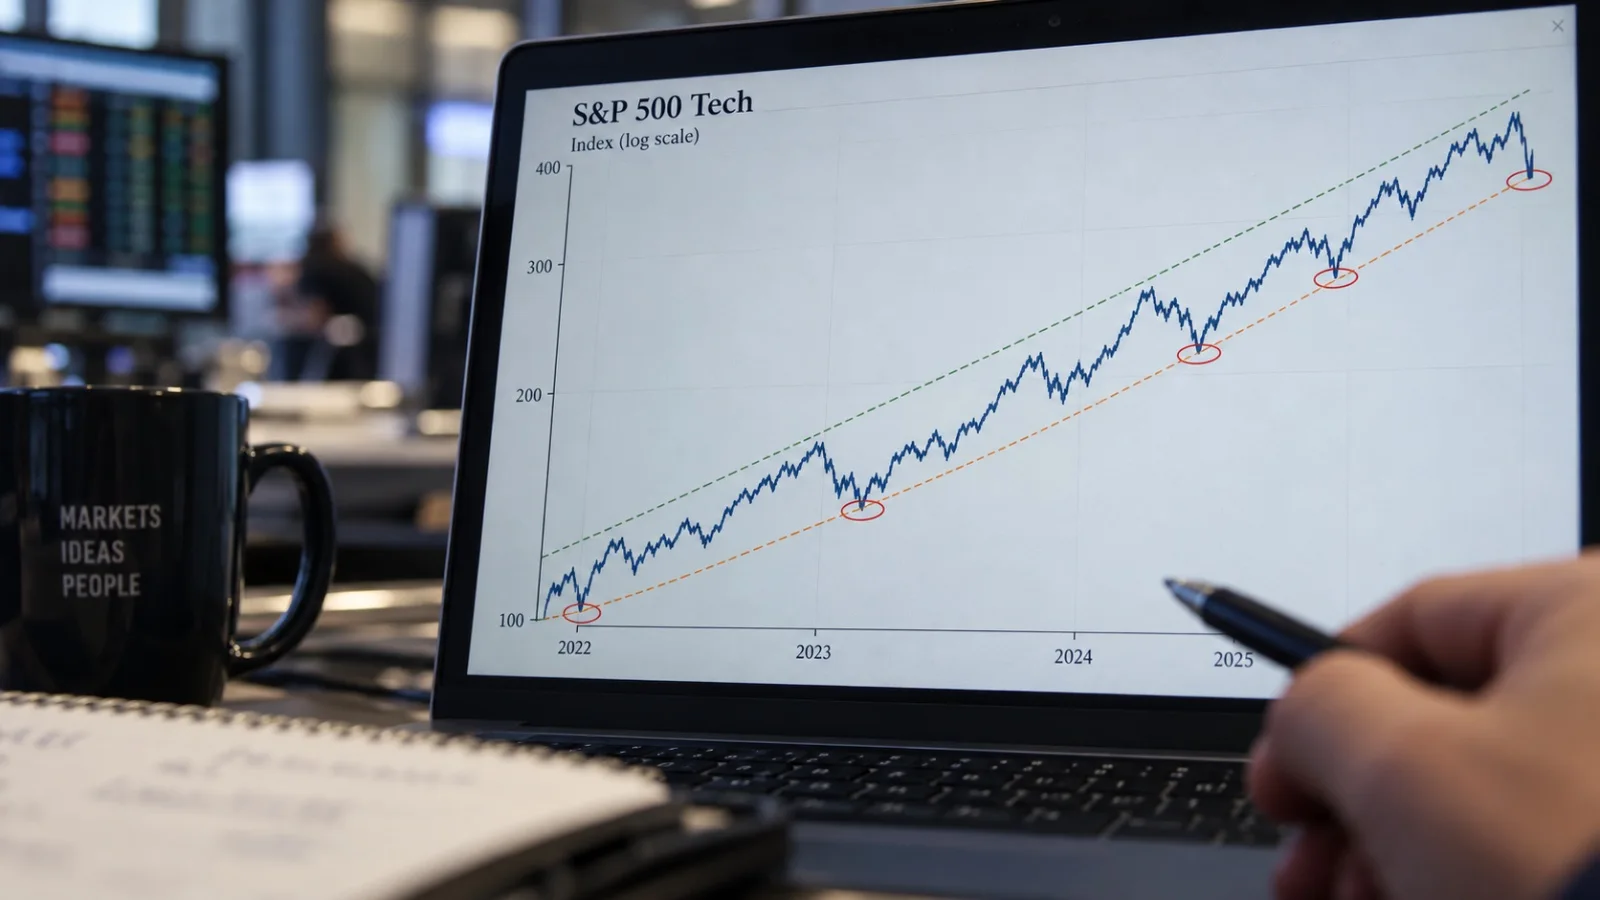
Lerner's log-scale chart also shows tech's long-term uptrend still intact. A log chart shows equal percentage gains as equal vertical distances, which makes it useful for comparing trends over several years.
Still, an intact trend line is very different from a forecast that returns will continue at the same pace. A chart describes the current trend. It does not guarantee future returns.
2. Why long-term returns stayed high despite repeated drops
The tech rallies described in the source show a pattern of overheating followed by correction.
| Rally | Gain | Following correction |
|---|---|---|
| Oct 2022 - Jul 2023 | +54% | -10% |
| Oct 2023 - Jul 2024 | +63% | -16% |
| Aug 2024 - Jan 2025 | +24% | -26% |
| Apr 2025 - Nov 2025 | +70% | -18% |
| Apr 2026 - Jun 2026 | +47% | -14% |
| Aug 2026 - Oct 2026 | +20% | Ongoing |
The timing and size of each rally are chart-based estimates. They were not independently verified by recalculating daily closes, so read them as approximate divisions of the waves.
What matters is the asymmetry between gains and losses, more than the number of declines.
A stock that rises 50% and then falls 20% is still 20% above its starting point. Conversely, a stock that falls 20% must gain 25% to get back to even.
Hypothetical price path: 100 → 150 (+50%) → 120 (-20%)
This is often called a "volatility toll." But enduring high volatility does not automatically pay an excess return. Long-term returns ultimately depend on earnings growth and the price paid.
3. How this correction differs from past ones
This time, investors have begun asking less about the growth of the AI industry and more about how the industry is financing the money that growth requires.
CoreWeave is the prime example.
According to Reuters, CoreWeave carries roughly $50 billion in debt. The yield on its bonds due 2031 rose above 16% last week before easing to about 15.13% on Oct. 19. That is more than a stock move. It shows the capital markets pricing the company's credit risk at a very high cost.
CoreWeave does have real contracts with large customers. But a backlog is not net income or free cash flow. What counts is how much is left after paying for GPUs, power equipment, depreciation and interest.
Two funding models for AI infrastructure: Companies that rely on their own cash have more room to fund capital spending from customer revenue and operating cash flow. Companies that rely on borrowing see their investment staying power shift with funding rates and refinancing conditions. Most real companies use a mix of both.
That does not leave Big Tech entirely free of credit risk. On Oct. 19, S&P Global warned that visibility into the AI-related debt and complex project-finance structures of major hyperscalers is insufficient. Even cash-rich companies can see free cash flow shrink if heavy capital spending continues.
In the end, this correction looks less like a split between "real AI and fake AI." It looks more like a process in which, even among companies chasing the same AI opportunity, shareholder returns and risk differ with the funding structure.
4. Will prices snap back like a rubber band?
After a sharp rally, a widening gap between price and moving averages can raise profit-taking pressure. But mean reversion is not a law of physics.
If earnings forecasts hold while the stock alone falls, the move may be a valuation reset. If the earnings outlook itself weakens and borrowing costs rise too, the correction may reflect real damage to corporate value.
On Oct. 19, the Nasdaq rebounded 1.78%. Semiconductor stocks also recovered. That is evidence buyers remain, but a single bounce makes it hard to say the correction is over.
What to Watch
| Indicator | What strengthens the bull case | What to be wary of |
|---|---|---|
| Tech 50-day and 200-day moving averages | Reclaiming and holding key support | Breaking long-term support and failing to recover |
| AI company bond yields | High-yield borrowing costs stabilize | Credit spreads widen again |
| Big Tech free cash flow | Cash flow holds despite higher AI spending | Rising capex keeps squeezing cash generation |
| AI revenue and margins | Real customer revenue growth and better profitability | Slowing revenue growth and rising costs |
FAQ
Q. Is this selloff the start of an AI bubble bursting?
- It cannot be confirmed yet. Similar corrections recurred in past bull markets.
- But if debt costs and weaker returns on AI investment persist, the decline could widen into a structural one.
Q. Are SOXX and XLK the same investment?
- XLK tracks the S&P 500 information technology sector.
- SOXX focuses on semiconductors and is more sensitive to industry conditions and single-stock volatility.
- QQQ tracks the Nasdaq-100 and includes sectors beyond tech.
Q. Is Nvidia safer than CoreWeave?
- Their profit structures, cash generation and reliance on financing differ.
- But Nvidia is also heavily influenced by the scale of AI data center spending. Customers cutting investment is an earnings risk.
Q. What is the most important buy signal in a correction?
- Whether the earnings outlook holds matters more than the size of the drop.
- Check the corporate bond market, cash flow, valuation and the long-term trend together.
What Lerner's chart shows is not a rule that bull markets last forever. It shows that bull markets wobble more often than people expect, and each wobble is a chance to reassess a company's real competitiveness and balance sheet.
This correction may also end in recovery. But that judgment will rest on the numbers companies report next, not on the shape of past charts.
Insight Times Editorial Desk