Alphabet Fell 12.6% in a Day. 406 S&P 500 Stocks Rose Anyway
The S&P 500 lost 0.57% last week and the QQQ fell 1.97%, but the equal-weight RSP gained 0.82%. So far the numbers point to big-tech weakness, not a broad market decline.
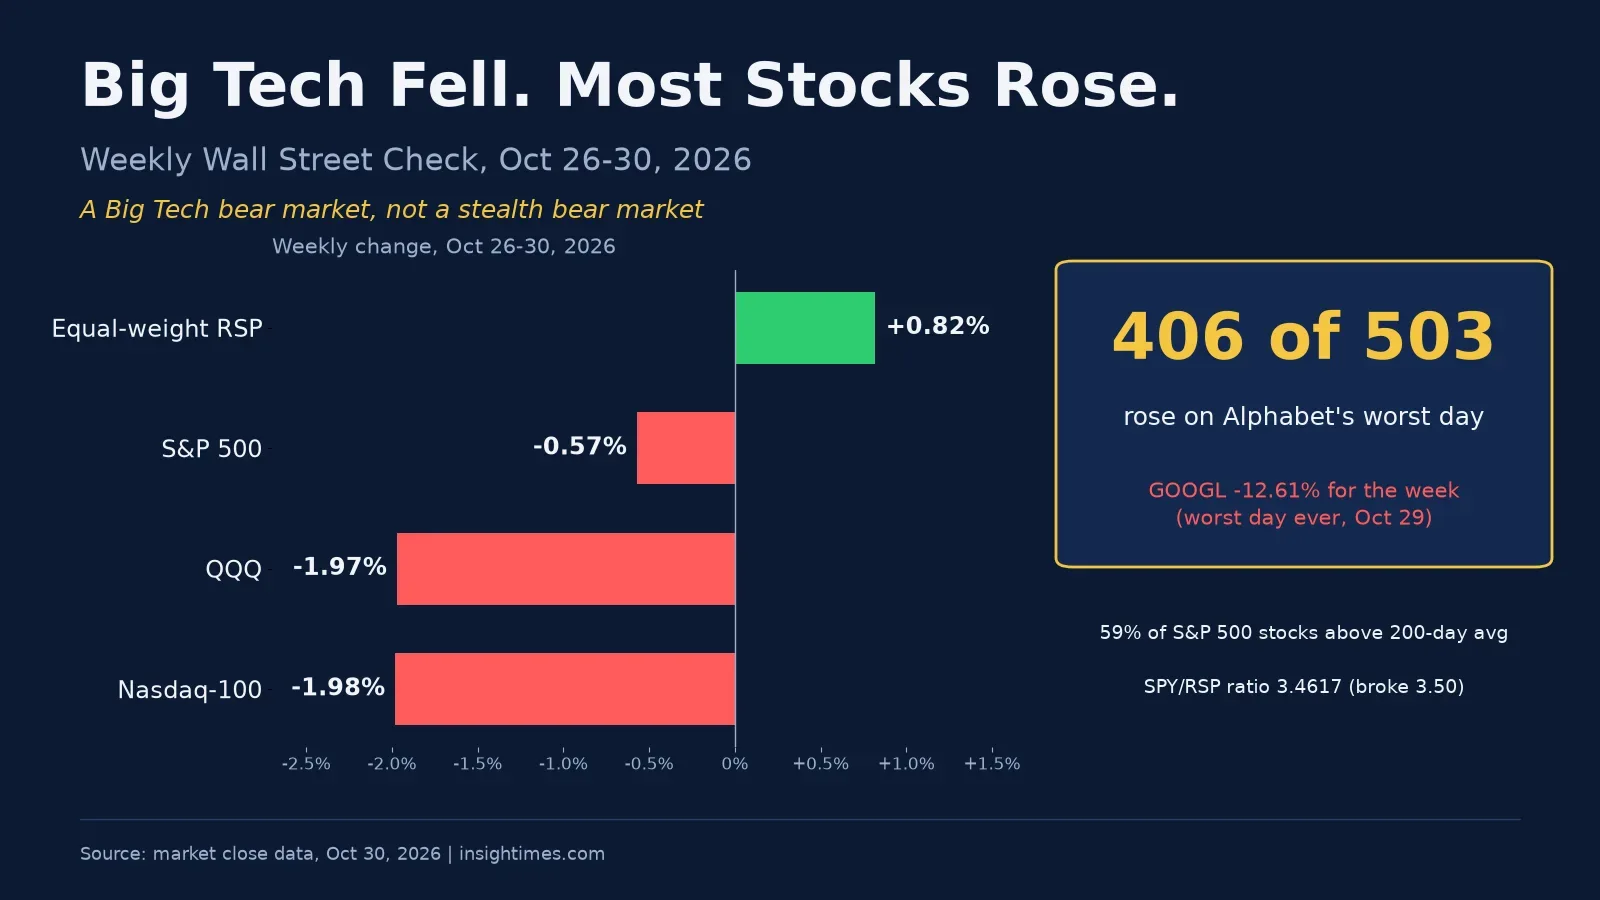
On October 29, Alphabet dropped 12.6% in a single session. Yet 406 of the 503 stocks in the S&P 500 rose that day. Is the whole US market breaking down, or only its largest tech names?
Bottom line: So far the numbers point to weakness centered on big tech, not the market as a whole. The question for next week is whether that split holds.
1. The index fell, but the average stock rose
From October 26 to 30, the S&P 500 fell 0.57%. The tech-heavy QQQ dropped 1.97%. But RSP, which holds the index's components at roughly equal weights, rose 0.82%. In the same US market, the biggest companies and the average company posted opposite results.
| Measure | Oct. 30 close | Week | October |
|---|---|---|---|
| S&P 500 | 7,580.07 | -0.57% | -0.93% |
| QQQ | 690.49 | -1.97% | -6.66% |
| RSP | 218.31 | +0.82% | +4.95% |
| Nasdaq 100 | 28,384.85 | -1.98% | -6.65% |
RSP beat the S&P 500 by 1.39 percentage points for the week and by 5.88 points for October. That is far from the picture of a "stealth bear market" in which everything weakens at once. "Big-tech-led weakness" is the more accurate description for now.
2. Alphabet's shock did not spread
Alphabet fell 12.6% on October 29. Concerns about expanded AI spending and cash-flow strain weighed on the stock. What matters is that 406 of the 503 S&P 500 components rose the same day. It was a tape in which one company's shock was easy to mistake for the market's direction.
For the week, Alphabet fell 12.61%, Meta 4.30% and Amazon 3.08%. Tesla rose 7.41% and Broadcom 1.37%. Results differed even within big tech. Drawdowns from their highs stand at 30.50% for Alphabet, 20.91% for Meta and 32.29% for Broadcom.
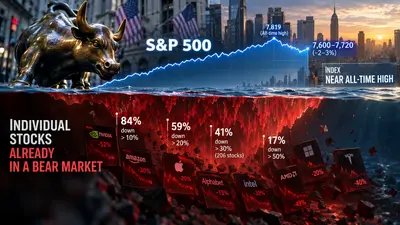
Underlying breadth matters more. The share of S&P 500 stocks above their 200-day moving average improved from 55.8% to 59%. The share down 20% or more from their highs fell from 33.4% to 32.0%. On Friday alone, though, that figure rose again from 30.0% to 32.0%. Whether weakness is spreading to other sectors needs continued watching.
3. The new question in the AI race is cash
This pullback is tied less to AI technology itself than to doubts about when AI spending can be recouped. According to the source data, Alphabet posted cash flow of -$9.07 billion, and Amazon's free cash flow has been negative for two straight quarters. AI spending is also an issue for Meta, whose credit outlook S&P cut to "negative."
Broadcom's five-year credit default swap (CDS) rose to 175.4 bp, a record. A CDS works like an insurance premium against a company defaulting on its debt. The question is whether the warning from credit markets persists longer than the drop in the stock price.
Separately, there were reports that Apple briefly overtook Nvidia as the largest company by market cap during trading on October 30. That was an intraday observation. It has not been confirmed as a first-place finish on a closing basis. One reading is that the market is valuing differently the companies pouring huge sums into AI infrastructure and those with a lighter spending burden. That does not mean Apple's lead is settled.
4. What the charts show
The S&P 500 sits below its 20-, 50- and 100-day moving averages but above its 200-day at 7,309.76. The QQQ is barely holding above its 200-day at 679.52, while RSP is above all four averages. That supports the view that selling pressure was concentrated in large tech stocks rather than the market as a whole.
| S&P 500 level to watch | Meaning |
|---|---|
| 7,699 | Near the gamma flip. A closing recovery could bring short-term stability |
| 7,527 | First checkpoint on a decline |
| 7,310 | Near the 200-day average; a check on the longer-term trend |
| 7,100 to 7,200 | Support zone cited by Morgan Stanley |
A gamma flip is a threshold beyond which options dealers' risk-management trades can amplify price moves. 7,699 is not a predicted rebound price but a level for gauging the market's reaction. A break below 7,310 would not confirm further losses either. It would be a prompt to revisit an investment thesis.
5. Earnings, the election and jobs collide next week
Apple reports and the ISM manufacturing data arrive on November 2. The US midterm elections and AMD earnings come on the 3rd, ISM services on the 4th, and the October jobs report on the 6th. With politics, earnings and economic data bunched into one week, volatility could rise. That is an estimate.
The scenarios in the source data are also estimates, not firm forecasts: bull 25% (S&P 500 at 7,700 to 7,820), base 45% (7,450 to 7,700) and bear 30% (7,100 to 7,450). These are not statistically tested probabilities. They are judgment weights for each scenario. Conditions matter more than outcomes. Watch together whether AI-related CDS spreads widen further, whether Brent crude holds above $115, and whether the S&P 500 closes back above 7,699.
The 10-year Treasury yield fell to 4.94% from 5.00% a week earlier. January Brent was $113.43, close to $115. Easing rate pressure and oil pressure coexist. A VIX of 19.42 also does not fit a claim that the market is in panic.
6. How might long-term, steady investors respond?
Changing a contribution plan with each day's news tends to erode the benefits of long-term investing. One approach is to keep the discipline of investing a set amount on set dates. Those uneasy about big-tech concentration could consider adding an equal-weight ETF. The source data's shift from a 60:40 SPY-to-RSP mix to as much as 50:50 is an example based on estimates, not the right answer for every investor.
It may be better not to rush into more semiconductor buying. The source's three-step checklist is also an estimate. First, check AMD's earnings and the election, and see whether the SOX holds support at 10,439. Second, watch for a further pullback near 9,600. Third, look for a move near 9,100 or a recapture of the QQQ's 200-day average. Whether to actually buy should depend on time horizon, cash holdings and existing semiconductor exposure.
7. Four signals to watch next week
- Market breadth: Whether the share of stocks above their 200-day average holds at 59%. A share of stocks down 20% from highs above 35% is an estimated threshold from the source data.
- Big-tech relative strength: Whether RSP holds the 214.9 to 215.1 zone, and whether the decline in the SPY/RSP ratio (3.4617) continues.
- Credit risk: Whether Broadcom's CDS widens further from 175.4 bp.
- Price and events: Whether the S&P 500 recovers 7,699, the QQQ's 200-day average of 679.52, Apple and AMD earnings, and the October jobs report.
Insight Times Editorial Desk