"You Should Have Bought Only the Crashes": The Hindsight Trap in Big Tech Investing
Cherry-picked chart lows make everyone look like a genius. Nvidia and Meta show why waiting for the bottom and building time in the market are different bets.

Editor's note
This piece pushes back on making market timing the foundation of how you buy. It is not an argument against buying more in a downturn. Dollar-cost averaging should be the base. On top of that, if you have spare cash, or can raise it by selling part of a stable ETF or bond holding, overcoming the fear and buying more of a Big Tech stock or ETF when it is oversold is a good choice.
1. Anyone is a genius on a past chart
A familiar line turns up in investing forums.
It does not sound wrong. An investor who put enough money in at those prices and held for years would have done very well.
But the argument has a fatal flaw. An investor in 2022 did not know that Meta's 2022 bottom was $90.
We scan a past chart for the lowest price, circle it, and assume we would have bought there. That is cherry-picking. It selects the favorable case and erases the uncertainty the investor actually faced.
2. What Nvidia teaches: a good company may not give you a cheap entry
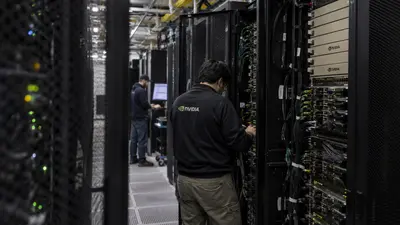
Nvidia's rise in 2023 and 2024 came from AI growth expectations and real earnings gains moving together.
In May 2024, Nvidia reported first-quarter fiscal 2025 revenue of $26 billion, up 262% from a year earlier. Data center revenue was $22.6 billion, up 427%. (Nvidia earnings release)
When a company's earnings power grows this fast, past prices are a poor yardstick for what is cheap or expensive. "I'll buy if it drops a little more." Meanwhile earnings forecasts keep rising, and the stock can move higher still.
In a strong uptrend, even a pause in the stock may not push RSI down to 30. If the buy condition is too narrow, an investor can sit in cash while the value of the business rises.
The key point is that an oversold signal does not necessarily appear at the price you want, and while you wait for it you can miss the gains.
Charles Schwab's research on market timing also shows the opportunity cost of delaying investment while waiting for a perfect entry. That research, however, does not directly test RSI strategies on individual big tech stocks. (Schwab research)
3. The truth about Meta at $90: the first oversold reading was not the bottom
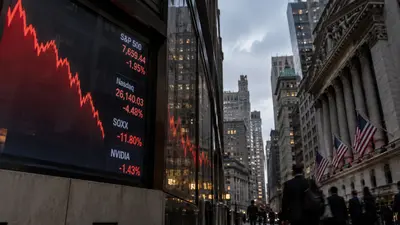
On Feb. 3, 2022, Meta fell about 26% in a day on a weaker outlook, Apple's privacy policy changes and fears of competition from TikTok. The stock dropped to the $230s. It was already a huge decline.
Meta did not stop there. On Nov. 3, 2022, it closed at about $88.
- After the Feb. 3, 2022 plunge: about $238
- Closing low on Nov. 3, 2022: about $88
- Buying right after the February plunge, through the November low: about -63% (simple price comparison, excluding dividends and trading costs)
Oversold only means a stock has fallen a lot. It is not a guarantee that it cannot fall further. When Meta traded near $90, metaverse spending, a slowing ad business and tougher competition were real problems.
We now know Meta later recovered its earnings and profitability. Investors at the time could be sure of neither whether it would recover nor when.
The hard part is not only the courage to press the buy button in a panic. It is sitting through further declines after buying while judging whether your thesis still holds.
4. Three pieces of math investors miss
First, cash has an opportunity cost
Holding cash earns interest and preserves the option to buy in a crash. In a long rising market, though, it can mean missed returns. This is cash drag.
In Vanguard research, investing an existing lump sum immediately beat spreading it over a set period in roughly two-thirds of historical cases. But that study compares timing for a lump sum already in hand. It does not mean that DCA, investing each time a paycheck arrives, is always optimal. (Vanguard research)
Second, a low average cost is not the same as great wealth
Consider a hypothetical stock trading at $300.
| Investor | Average cost | Shares | Current value |
|---|---|---|---|
| Bottom buyer A | $150 | 20 | $6,000 |
| Regular investor B | $250 | 100 | $30,000 |
B's average cost is higher, but the value is five times larger. B did put in far more money, so this is not a return comparison.
Average cost, rate of return and final wealth are different measures. Performance should be compared using the same amount invested and the same timing.
Third, a good strategy has to be executable
"Buy below RSI 30" is a simple rule. But what if it falls from 30 to 25, then 20? Is there cash left to add? Has the thesis on the stock already broken? The signal alone cannot answer these questions.
The strength of DCA is not an ability to predict prices. It is investing on a set rule, which reduces the role of emotional judgment.
5. What to watch next
- Earnings estimate revisions: if the stock falls, do forward revenue and EPS forecasts hold?
- Cash flow and spending burden: does growth investment turn into real profit and free cash flow?
- Valuation: has the decline made the price meaningfully better relative to the company's value?
- Portfolio concentration: after adding, is the position still within a loss you can bear?
The takeaway
What we should really learn from the chart is not the past low. It is the question of what principles someone who could not know that low should have followed.
Steady investing keeps you in the market during rallies. Cash set aside for adding gives you a chance to use better prices in a panic.
Neither guarantees success. But combining the two to fit your own risk tolerance is likely to produce a long-term strategy you can actually carry out, more so than trying to pick the perfect bottom.
Sources: NVIDIA Investor Relations, Reuters, Vanguard Research, Charles Schwab, StatMuse. See the text for comparison bases and assumptions.