The S&P 500 Looks Fine. So Why Do Most Stocks Hurt?
The index sits near its high, yet most of its members are down 20% to 30% or more from their own peaks. A look at the "stealth bear market" and the numbers long-term investors should watch.
Five hundred players on the field, but the broadcast shows ten
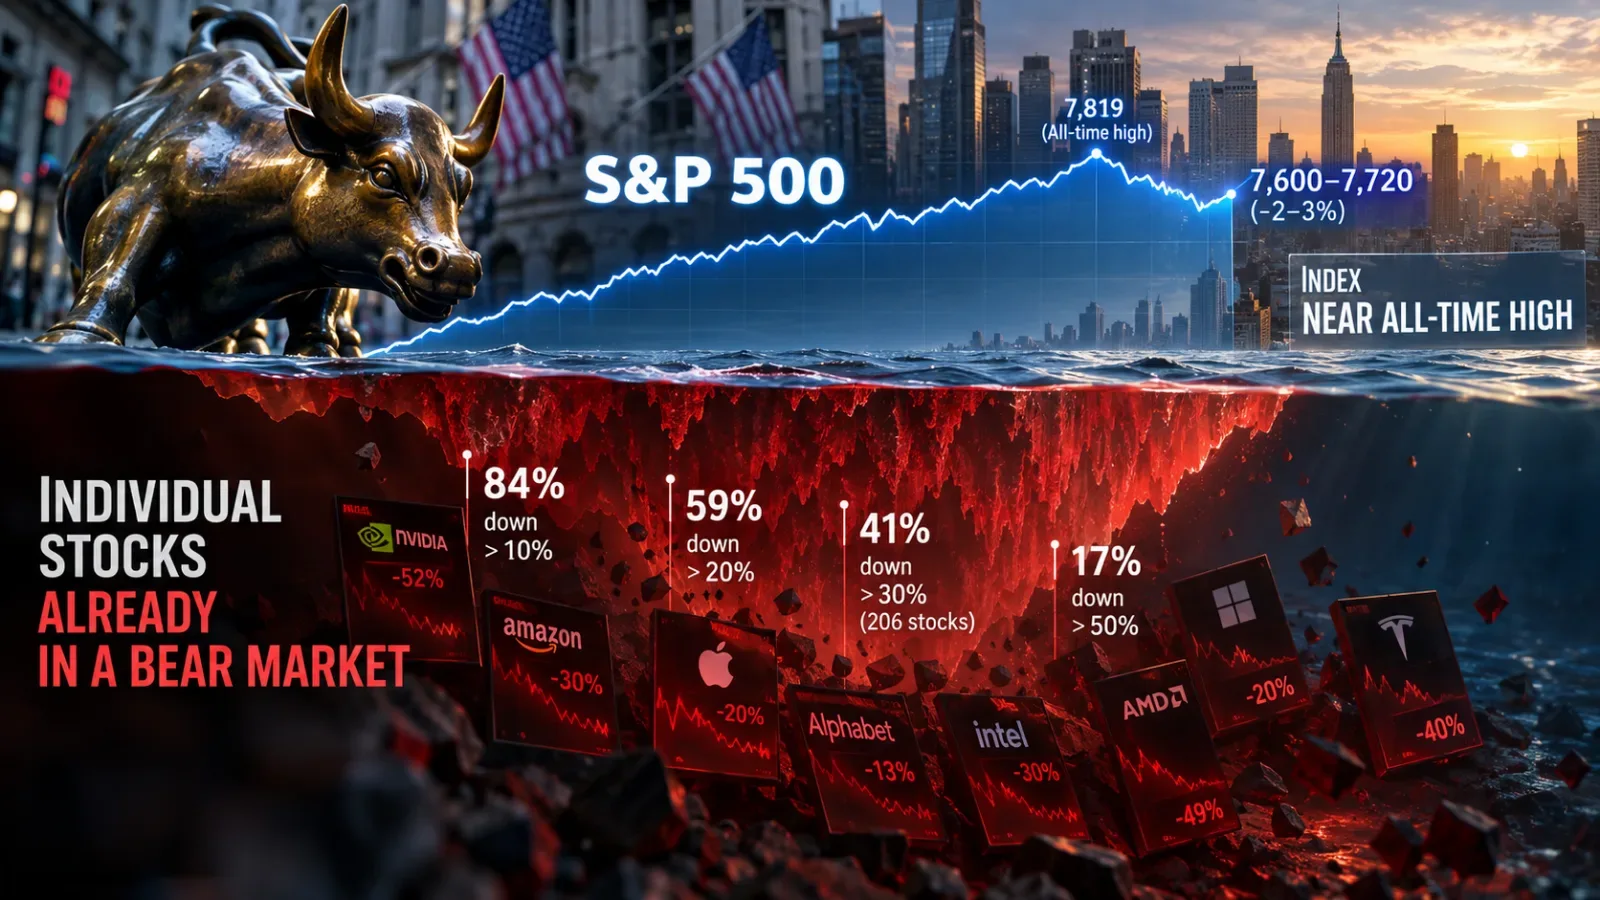
The index looks strong. Why does your account not? You are not imagining it. In a mid-October tally cited in the source report, 84% of S&P 500 stocks were at least 10% below their own highs. About 59% were down 20% or more, and 41% were down 30% or more. About 17% were down 50% or more.
The yardstick here is each stock's decline from its own peak, not the index's decline from its peak. Stocks may have peaked on different dates. These figures should not be compared directly with the index's drawdown on a single day.
Figure 1. Individual drawdowns hidden by the index (share of S&P 500 stocks, decline from each stock's own high, mid-October tally cited in the report)
- Down 10% or more: 84%
- Down 20% or more: 59%
- Down 30% or more: 41%
- Down 50% or more: 17%
The categories overlap. A stock down 30% is also counted among those down 20%.
The reason lies in how the index is built. The S&P 500 does not give its 500 companies equal votes. It gives more weight to the moves of companies with larger market capitalizations. It looks like a class average, but it works more like an exam in which a few top students move the average a great deal.
Figure 2. Who produced the index's gain (share of contribution)
- Top 10 stocks: about 70%
- The other 490 stocks: about 30%
The report measures the index's gain of roughly 23% from the late-March 2026 low to mid-October. The top 10 stocks supplied about 70% of that gain and the remaining 490 about 30%. The top 10's share of market capitalization is a separate figure, about 40%.
October also produced the opposite picture. As of Oct. 29, the standard S&P 500 was up 0.9% for the month. The equal-weight index, which gives all companies similar weight, was up 5.7%. Stocks that had been ignored for a while bounced, while the giant tech names took a breather.
Figure 3. Same market, different monthly returns (as of Oct. 29)
- S&P 500, month: +0.9%
- Equal-weight index, month: +5.7%
- Median stock return: +7.4%
The median stock is the one in the middle when stocks are ranked by return.
Moving averages are footprints of where a stock has been
A moving average is a line that averages a stock's price over the past 20, 50, 100 or 200 days. Over a long span it is the gentle slope of a road. Over a short one it is the most recent footsteps. A stock falling below a line does not mean it is about to plunge. It is a signal that the current price is weaker than the recent average.
The report says that on Oct. 30 the S&P 500 tested its 100-day moving average, around 7,613, intraday. The 50-day line near 7,698 and the 20-day line near 7,737 sat above the index at the time. The report reads them as hurdles the index would need to clear again in a rebound.
Figure 4. Key reference levels for the S&P 500 (index points, around Oct. 28-30 per the report)
- Intraday high: 7,865.52
- Closing high: 7,819.00
- 20-day: 7,737.04
- 50-day: 7,698.30
- 100-day: 7,613.06
- 200-day: 7,309.67
Moving averages shift over time, and support and resistance levels are not fixed walls of price.
| Level | Report figure | How to read it |
|---|---|---|
| Closing high / intraday high | 7,819.00 / 7,865.52 | Whether the index retakes its prior peak |
| 20-day / 50-day simple average | 7,737.04 / 7,698.30 | Whether short- and medium-term trends recover |
| 100-day simple average | 7,613.06 | Midpoint reference in a correction |
| 200-day simple average | 7,309.67 | Reference line for the long-term trend |
| Tactical downside scenario | 7,100 to 7,200 | A forecast only, not a guaranteed floor |
The relative strength index (RSI) works like a speedometer for how fast a price has recently risen or fallen. In the report, RSI fell to 31.48 on Oct. 30. A reading near 30 is generally taken to mean selling has intensified, but a low speedometer reading does not mean an immediate rebound. MACD is closer to an accelerometer, showing whether short-term momentum is outrunning longer-term momentum. The report's reading of -8.80 on Oct. 30 is used to explain a weakening short-term trend. No indicator guarantees future prices.
Market breadth shows how many players are running together
Breadth counts how many stocks are actually rising or have recovered their trend, instead of looking at the index. It is like a roll call: is this a race run by a few giant companies, or are the laggards running too?
According to the report, 21% of S&P 500 stocks were above their 50-day moving average in late September. By Oct. 29 that had risen to 65%. The share above the 200-day line recovered from 46% on Oct. 6 to roughly 63% to 65.4% on Oct. 29.
Figure 5. Are the stocks inside the index getting back up?
- Late September, above 50-day: 21%
- Oct. 29, above 50-day: 65%
- Oct. 6, above 200-day: 46%
- Oct. 29, above 200-day: 63% to 65.4%
The 50-day and 200-day lines are different yardsticks, so compare only like with like.
Think of SPY as the ETF in which large companies have the loudest voice, and RSP as the one that gives each company a similar voice. The SPY/RSP ratio tracks which is ahead: the "few star players" or the "whole team." The ratio also depends on the two ETFs' per-share price levels, so no single number should drive a trading decision.
There is a significant counterargument. The rebound in neglected stocks could be a one- or two-day snapback. The report notes that in fewer than half of past cases did a similar relative-strength rebound lead to sustained outperformance over the following month. The thing to check is whether a broad-based advance lasts.
Why earnings are strong but stock prices feel shaky
A stock price reflects not only what a company earns but also the multiple the market pays for those earnings. It is like two workers on the same salary who are approved for different loan limits. Even when profits improve, share prices can be weak if rates and risk perception push valuation multiples down.
In Citadel Securities data cited by the report, from June 30 to Oct. 12, forward 12-month earnings estimates for memory chips were revised up 25% while the forward P/E fell 34%. For AI infrastructure, estimated earnings rose 25% while the P/E fell 22%. The fair reading is not that prices simply got cheap, but that the market is recalculating growth expectations and investment costs at the same time.
Figure 6. Earnings forecasts went up (forward EPS estimate revisions, June 30 to Oct. 12, 2026)
- Memory: +25%
- AI infrastructure: +25%
- S&P 500: +10%
These are changes in forward EPS estimates, not confirmed earnings. Over the same period, forward P/E changed by -34% for memory, -22% for AI infrastructure and -6% for the S&P 500.
Big tech companies are also spending heavily on AI data centers. Even if revenue grows over the long run, near-term capital spending and cash flow can come under strain. That is why revenue growth, operating profit, free cash flow and the cost of debt should be read together.
The road ahead: a three-branch map, not a single target
A target level is a conditional hypothesis, not a promise. The report divides the likely paths into three. Periods and assumptions are not identical, so these ranges should not be read as forecasts with assigned probabilities.
Figure 7. Price ranges for Scenarios A, B and C (S&P 500 points)
- A, base: 7,100 to 8,000
- B, bull: 8,400 to 9,000
- C, bear: 6,500 to 6,800
Scenario A combines a correction low of 7,100 to 7,200 with a later year-end recovery target of 7,967 to 8,000 into one wide path. B is a range of 8,400 to 9,000 during 2027. C is a 6,500 to 6,800 risk zone. The timing of each scenario differs.
| Path | Report range | Conditions | Why it could be wrong |
|---|---|---|---|
| A, base | Correction to 7,100-7,200, then 7,967-8,000 by year-end | Selling pressure eases, buybacks resume, financial conditions loosen | Liquidity could worsen for longer before a rebound |
| B, bull | 8,400-9,000 during 2027 | Oil stabilizes below $100, rate pressure eases, gains broaden | Earnings growth alone may not justify high prices |
| C, bear | 6,500-6,800 | Oil above $115-120, worries over AI investment payback, credit stress | Earnings and a breadth recovery could absorb the shock |
Why institutions' numbers differ
| Institution or view | Forecast cited in the report | Focus |
|---|---|---|
| Average of 19 firms (Bloomberg) | 7,967 at end-2026 | Earnings-based gradual gains |
| Morgan Stanley | 8,000 at year-end / 8,300 by mid-2027 | A possible final correction first |
| Goldman Sachs | 8,000 / 8,700 at end-2027 | Earnings growth over valuation multiples |
| Kobeissi Letter | Possible 9,000 or higher | Assumes easing oil prices and monetary tightening |
| Capital Economics | 6,500 in 2027 | Wary of high valuations and downside risk |
Institutional forecasts and attributions are secondhand, taken from the source report. They are not independently confirmed against each firm's original publication. Target years and time frames differ.
This article draws on a technical analysis report on the S&P 500's "stealth bear market." All figures and institutional forecasts are cited from that report and are not live market data or independently verified. Charts are illustrations built from the report's figures. This is investment information and education, not a recommendation to trade any stock or ETF.
Insight Times Editorial Desk