Big Tech's Cash Is Draining. Its AI Business Is Earning More
Nomura's J-curve points to a timing gap between falling free cash flow and the payback on AI spending. For investors, the two are not the same thing.
The 20-second read
Is cash falling because the business isn't making money?
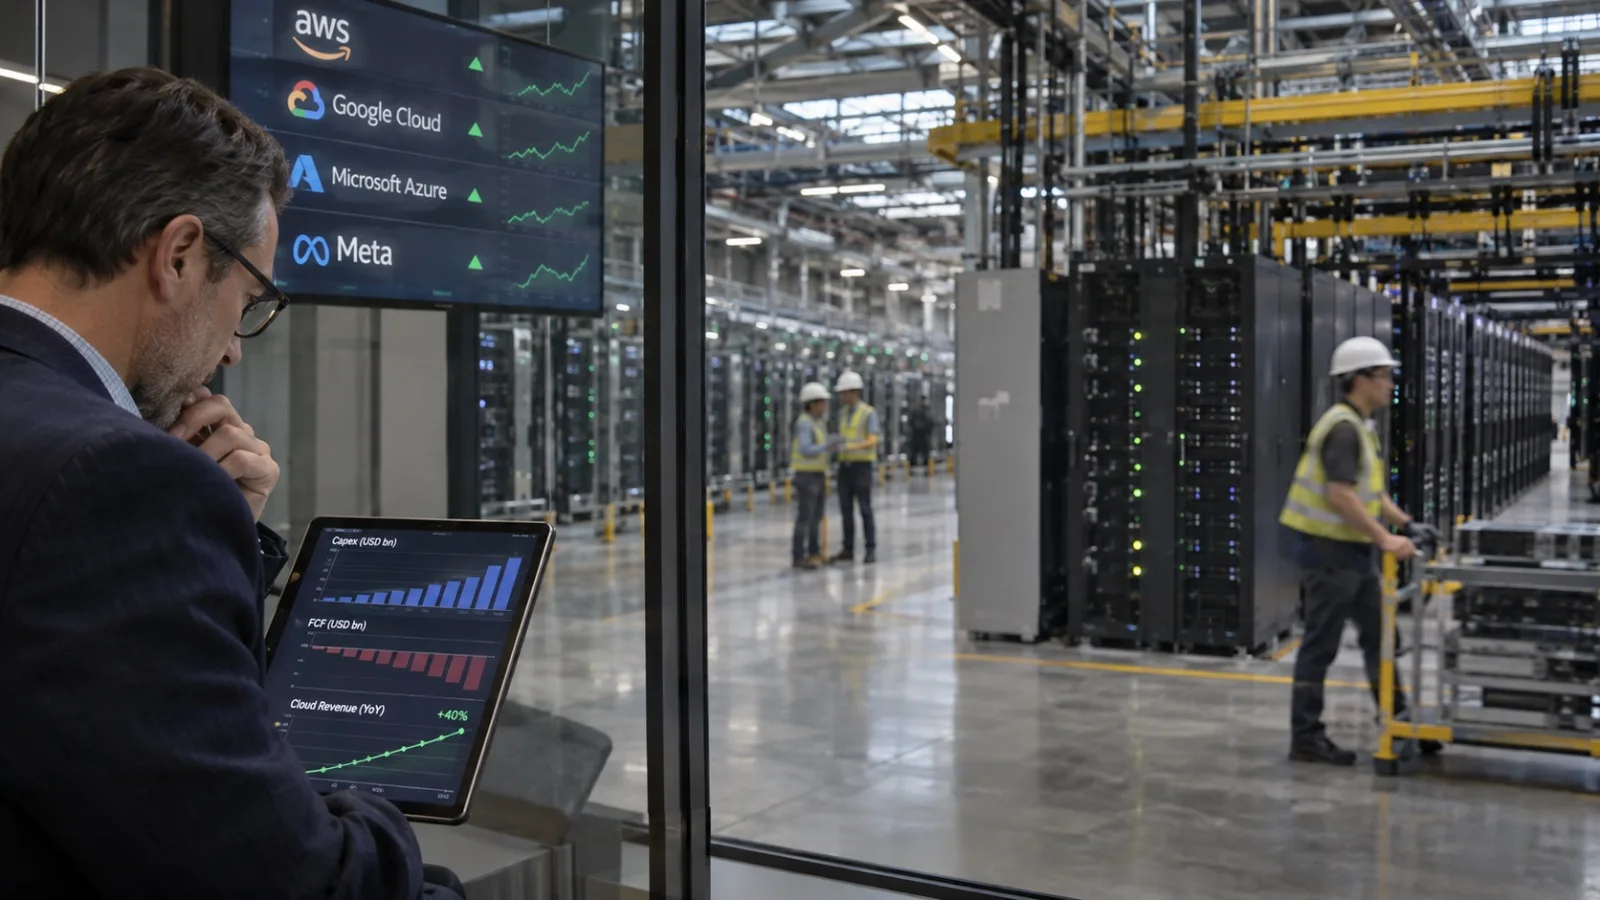
Amazon generated $168.3 billion in operating cash flow over the past 12 months. Its free cash flow was still negative, at $42.4 billion. Capital spending, led by AI infrastructure, surged.
Alphabet tells a similar story. It reported third-quarter operating cash flow of $42.3 billion, but capital expenditure reached $51.4 billion. Free cash flow (FCF) fell to -$9.1 billion.
When a company earns cash from operations but spends more than that on data centers and chips, FCF turns negative.
The point that matters is whether a deficit comes from weak operations or from expanded investment for future earnings.
The cloud units are already highly profitable
| Metric (Q3 2026, YoY) | AWS | Google Cloud |
|---|---|---|
| Revenue growth | +39% | +103% |
| Operating margin | 38.7% | 36.2% |
Source: Amazon and Alphabet third-quarter 2026 earnings releases.
AWS posted quarterly revenue of $46 billion and operating income of about $17.8 billion. Google Cloud posted revenue of $30.7 billion and operating income of about $11.1 billion.
Google Cloud's operating margin rose to 36.2% from 23.7% a year earlier, a gain of 12.5 percentage points.
That suggests cloud profitability can improve even as AI infrastructure spending grows. One caveat: the cloud segments also include legacy businesses, so these figures do not directly prove the return on new AI data center investment.
What the J-curve really means: cash goes out first, comes back later
Nomura's J-curve is simple.
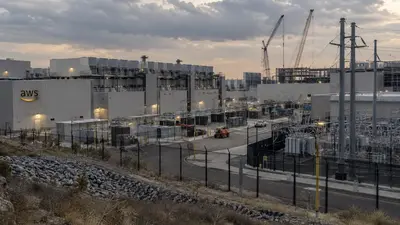
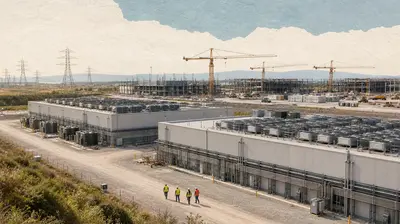
Building a data center and buying GPUs sends out a huge amount of cash at once. The revenue and cash a data center generates once it is running arrive over several years.
Companies also build new data centers every year. Cash may start flowing in from last year's facilities, but if this year's investment is larger, overall FCF can keep worsening.
How the J-curve works
A conceptual illustration of the J-curve principle: cash falls during the initial investment burden, then rises as investment is recovered. It does not show actual company FCF figures or Nomura's estimated curve.
Nomura's Nov. 2 note suggests there may be a lag between operating profit growth and an FCF recovery at Big Tech. It models the cash flow burden around 2028 and the recovery path after that.
There is an important condition. Even if investment keeps rising, the J-curve recovers only if cash generated by existing facilities grows faster than the burden of new investment.
Customers are waiting. The question is contract quality
The numbers behind the AI supply shortage are large.
| Company | Disclosed contract balance |
|---|---|
| Microsoft commercial RPO | $677 billion |
| AWS backlog | $578 billion |
| Google Cloud backlog | $560.8 billion |
Microsoft's commercial remaining performance obligation (RPO) rose 73% from a year earlier. AWS disclosed its $578 billion backlog in its third-quarter earnings discussion. Google Cloud's is $560.8 billion.
Contracts worth hundreds of billions of dollars are a positive sign of long-term demand. But a contract balance is not cash inflow. The speed at which it converts to revenue depends on customer usage, contract length, cancellation terms and the customer's ability to perform.
A key issue is whether AI company customers earn enough to keep paying for massive amounts of infrastructure.
The bottom line: the ability to recover cash after investing matters as much as the size of the AI spending itself. Investors who read the cause behind the minus sign on the cash flow statement, and the path to recovery, are likely to judge better than those who read only the sign.
- Yes. Operating profit reflects depreciation spread over time, while the cost of buying equipment is recorded when the cash goes out.
- No. That path is Nomura's estimated scenario. The timing of recovery can change depending on the growth rate of new investment, the profitability of existing equipment, and customer demand.
- During an infrastructure expansion, chip suppliers can benefit first. But when investment slows, earnings volatility at chip companies can grow larger. Valuation also needs to be weighed.
- It is a situation where investment keeps rising while revenue growth and margins slow at the same time. That could signal a worsening return on investment, not just a timing gap in cash flow.
What to watch
Insight Times Editorial Desk