Investors Said They Were Scared. Their Money Bought Stocks.
Sentiment surveys turned gloomy this week, yet billions flowed into S&P 500 ETFs and the index barely budged as Nvidia slid. Four lessons for long-term investors.
The 20-second read
On Wall Street this week, what investors said and what they did pointed in different directions. Nvidia fell sharply, yet the index slipped only a little. Here are four things long-term investors can take from the week.
1. Everyone says they are scared. Why did money go into stocks?
Talk of fear and actual behavior do not always match. The most interesting scene on Wall Street this week was less the price moves than this gap.
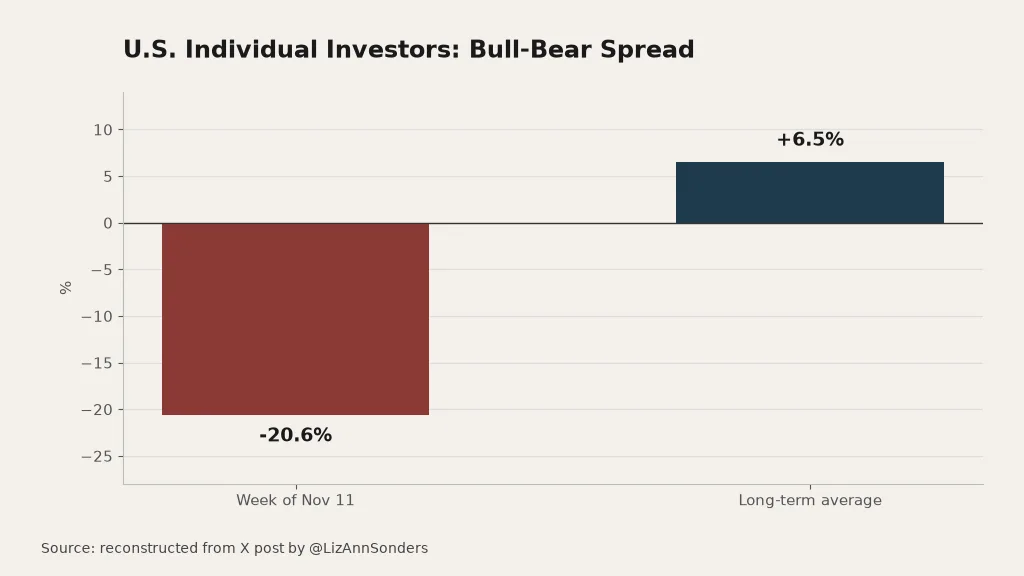
Liz Ann Sonders, chief investment strategist at Charles Schwab, shared the American Association of Individual Investors (AAII) survey. For the week ended Wednesday, Nov. 11, the share of bulls was 20.6 percentage points below the share of bears. The long-term average runs the other way, with bulls ahead by 6.5 points. Investors' words were the opposite of their usual stance.
Bulls trail bears by more than 20 points in the survey. The long-term average (bulls ahead by 6.5 points) is the reverse.
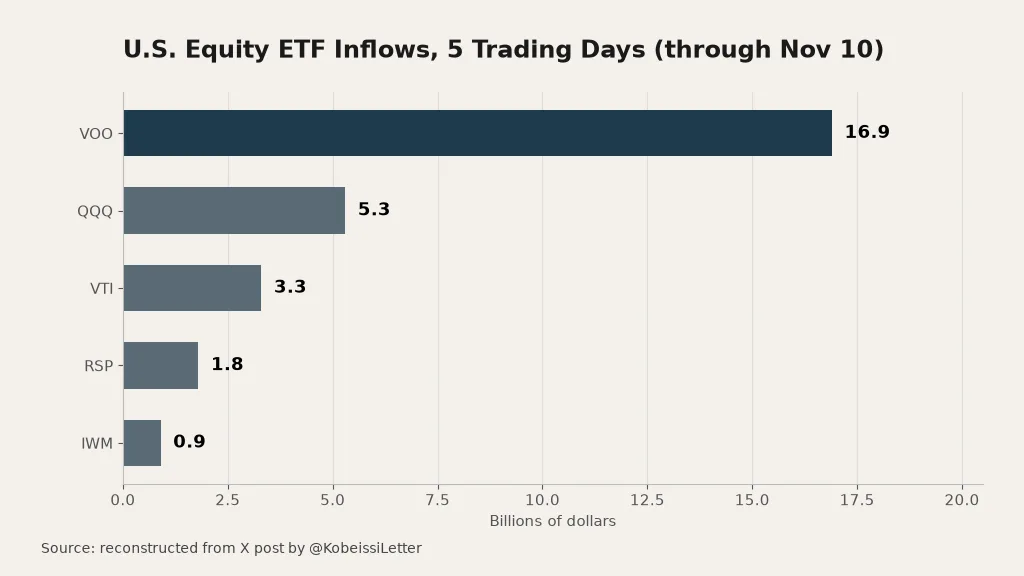
Money moved differently. According to a tally from the independent market newsletter The Kobeissi Letter, based on Koyfin and Bloomberg data, $16.9 billion flowed into VOO, an exchange-traded fund that tracks the S&P 500, over the five trading days through Tuesday, Nov. 10. An ETF is a basket that holds many stocks in one product.
Investors said they were scared, but the most money went into S&P 500 ETFs.
A survey shows feeling. Fund flows show choices. They may reflect different people. Even so, one fact is clear: as pessimism grew, large sums went into baskets of stocks.
The first lesson is simple. To gauge the mood, read the survey. To see what investors chose, follow the money.
2. A leader fell by a third. Why did the index barely move?
When a market leader like Nvidia stumbles, it can feel as if the whole US market is about to fall with it. This time was different.
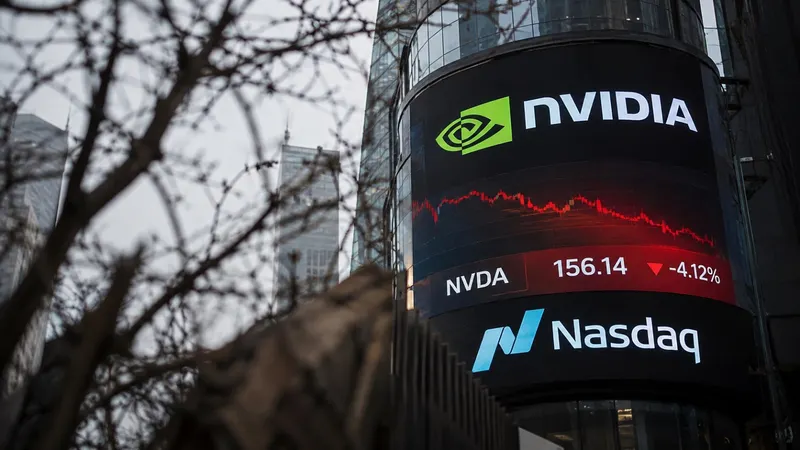
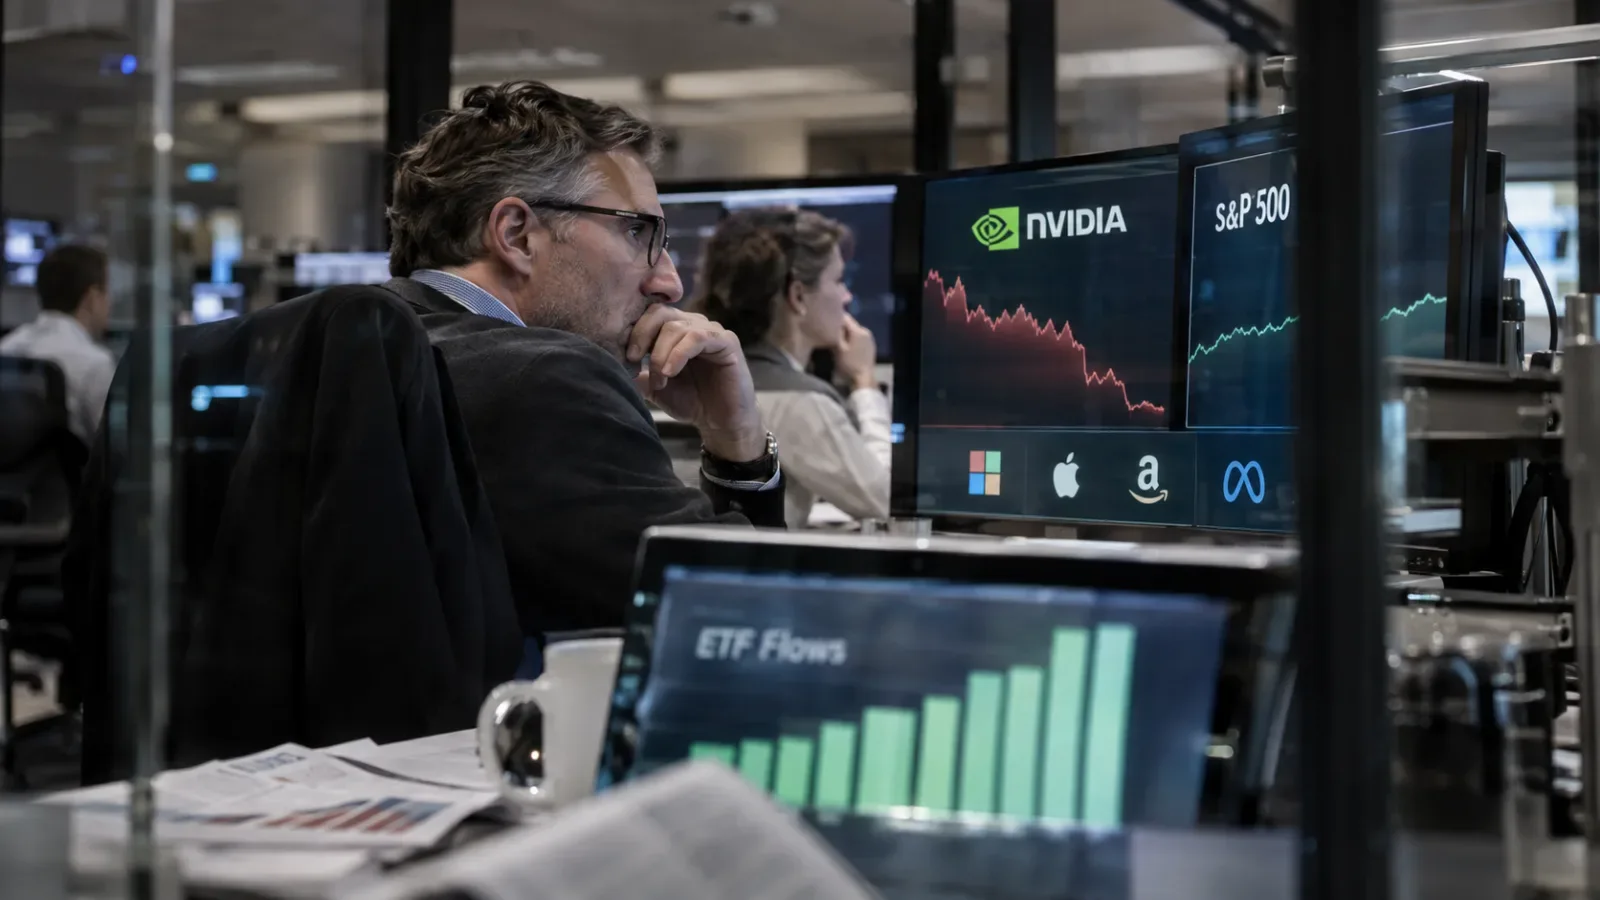
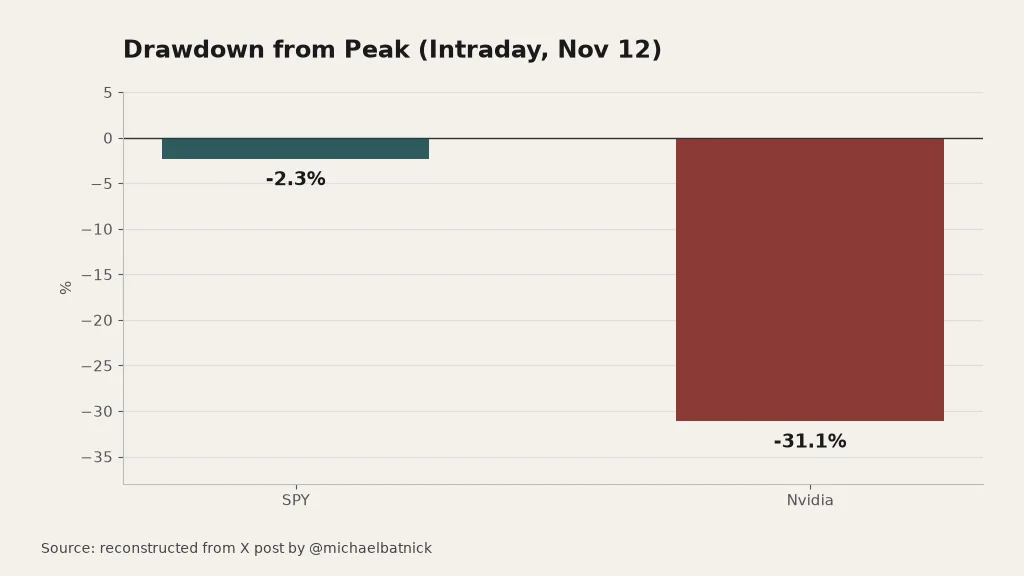
In intraday data for Thursday, Nov. 12, shared by Michael Batnick of Ritholtz Wealth, Nvidia was down 31.1% from its high. SPY, the ETF that tracks the S&P 500, was down just 2.3%.
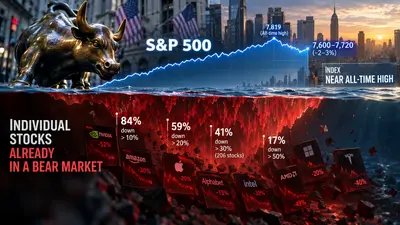
Usually, a big Nvidia drop pulled the index down with it. This time Nvidia fell more than 30% while the index slipped only about 2% from its peak.
How was that possible? Fidelity's Jurrien Timmer said AI-related stocks and the rest of the market were moving in different directions. Ed Yardeni likewise observed that the index has been roughly flat since August, while the sectors inside it have diverged widely.
An index is one number, but the companies inside it do not share one fate. Reading one leader's trouble as the whole market's trouble makes it easy to miss changes happening elsewhere.
The second lesson: do not mistake a calm index for a calm market.
3. Companies are earning more. Why is the market paying less?
Stocks rise in two broad ways. Companies actually earn more, or investors put a higher price on the same earnings. Right now the two forces point in different directions.
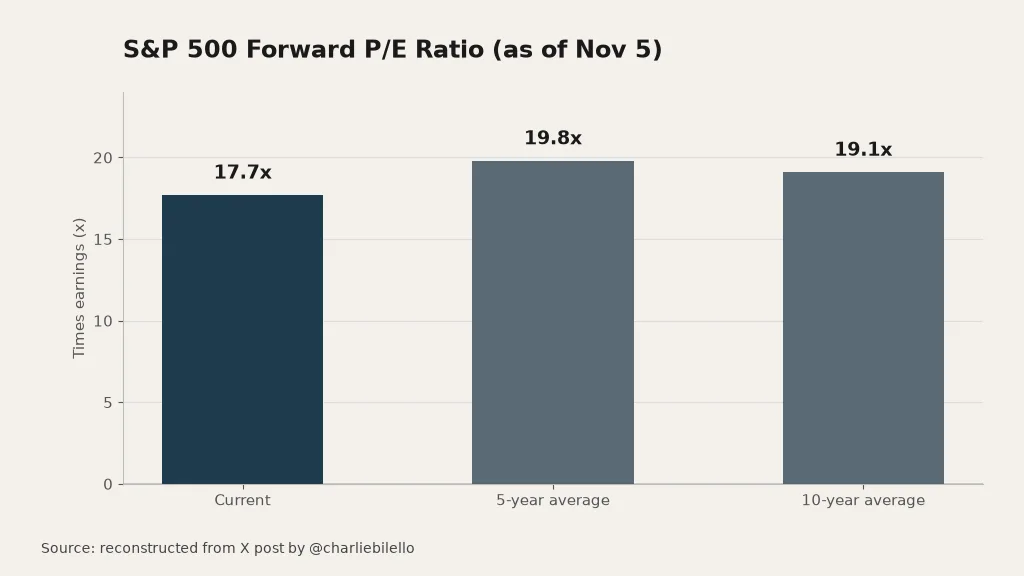
In data from Charlie Bilello of Creative Planning, as of Thursday, Nov. 5, the S&P 500's forward price-to-earnings ratio was 17.7, the lowest since November 2023. The forward P/E shows how many times expected earnings for the next 12 months the market is willing to pay.
The "price tag" the market puts on next year's expected earnings is the cheapest since November 2023. Earnings estimates for this year are up 34%, while the index is up only 7% (as of Nov. 5).
When earnings forecasts rise faster than prices, the multiple can fall. A lower multiple alone does not prove stocks are cheap. What matters is whether the expected earnings actually arrive.
Rates are part of the backdrop. Mohamed El-Erian said markets are pricing 3.5 rate hikes over the next 12 months, and Jim Bianco described the pace of the rise in yields as approaching "historic." Higher rates tend to lower the value investors place on future earnings.
Timmer asked whether the pace of earnings growth is nearing a peak, but argued that if the absolute level of earnings does not roll over, the market can go higher. A message from Terry Smith, quoted by Compounding Quality, which champions long-term investing in high-quality stocks, says the same: over long periods, earnings are what carry returns.
The third lesson: watch not only the price, but where earnings are heading and what the market pays for them.
4. Same week, four Wall Street heavyweights. How did they read it differently?
Looking at the same market, Wall Street split into four views, because each asked a different question.
Tom Lee of Fundstrat looked at the state of money. His reading is that the price drop reflects margin calls on leveraged investors and selling to raise cash for large IPOs. In this view, selling pressure does not necessarily mean damage to company value.
Dan Ives, a partner at Yorkville Ives, argued that the AI revolution is bigger than any one person. The view separates one executive's absence from the industry's long-term growth potential.
Michael Burry asked the opposite question. What matters, he suggested, is not one person but the cracks in the business behind him. If attention is captured by a personality dispute, the competitive structure and the business's weak points can be missed.
Cathie Wood of ARK Invest turned to history. She pointed to how US stocks generally rose in the year after midterm elections, to place current worries on a longer timeline.
Lee watches funding pressure, Ives the durability of the industry, Burry the fragility of the business, Wood the sweep of history. Rather than pick one as correct, it may be worth asking which question is missing from your own investment thinking.
The fourth lesson: instead of following a famous person's conclusion, work out which variable that person is watching.
5. So how should a long-term investor read this week?
The answer for the week is fairly clear. Long-term investors watch money and earnings, not mood. That means checking actual fund flows, what is happening inside the index, and what companies earn, rather than the volume of alarming news.
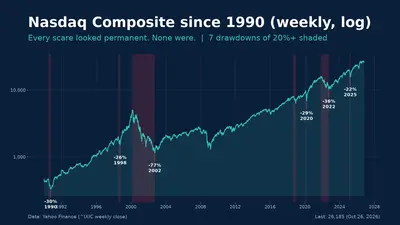
Bilello noted that the US market has had 34 pullbacks of more than 5% since March 2009. Each time, there was news that made selling feel necessary. His message is that wealth is built not by avoiding pullbacks but by enduring them.
For long-term investors who buy on a schedule, there is reason to stick with the set interval and amount rather than reverse the plan over a single headline. Whatever a person owns, it is still worth checking separately whether a company's ability to earn has broken down. Endurance is not indifference.
Do not let a scary headline make the decision. Not being gaslit by the news does not mean ignoring bad news. It means separating the emotion a headline throws off from the facts, and asking again the questions that fit your own time horizon.
Three markers to keep tracking: the gap between words and money, the two markets inside the index, and earnings versus the price tag.
Next week, we will look at how those three change.
- Sentiment surveys and actual trading may reflect the behavior of different people.
- In the AAII survey for the week of 11/11, optimists trailed pessimists by 20.6 percentage points.
- Yet VOO, an S&P 500 ETF, took in $16.9 billion over the five trading days through 11/10.
- In intraday data on 11/12, Nvidia was down 31.1% from its peak and SPY was down 2.3%.
- Julien Timmer of Fidelity explained that AI-related stocks and the rest of the market moved in different directions.
- Sectors inside the index likely moved differently from one another.
- It means the market is paying 17.7 times the earnings companies are expected to make over the next year.
- As of 11/5, that is the lowest level since November 2023.
- However, a low multiple alone does not prove that stocks are cheap.
- As of 11/5, this year's earnings forecasts were up 34% and stock prices were up 7%.
- When earnings forecasts rise faster than prices, the multiple can fall.
- Higher interest rates tend to lower the value placed on future earnings, so this can be seen as part of the backdrop.
- The article says to check actual money flows and company earnings rather than the mood.
- According to Bilello, there have been 34 pullbacks of more than 5% since March 2009.
- Still, you need to check separately whether the earnings power of the companies you own has broken down.
What to watch
Insight Times Editorial Desk