Don't Panic-Sell, and Don't Bet It All on a Bottom: Rules for a Rattled Market
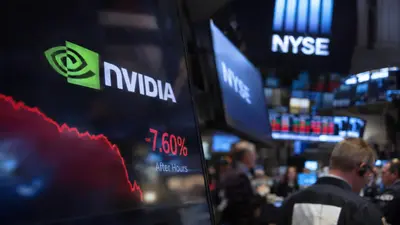
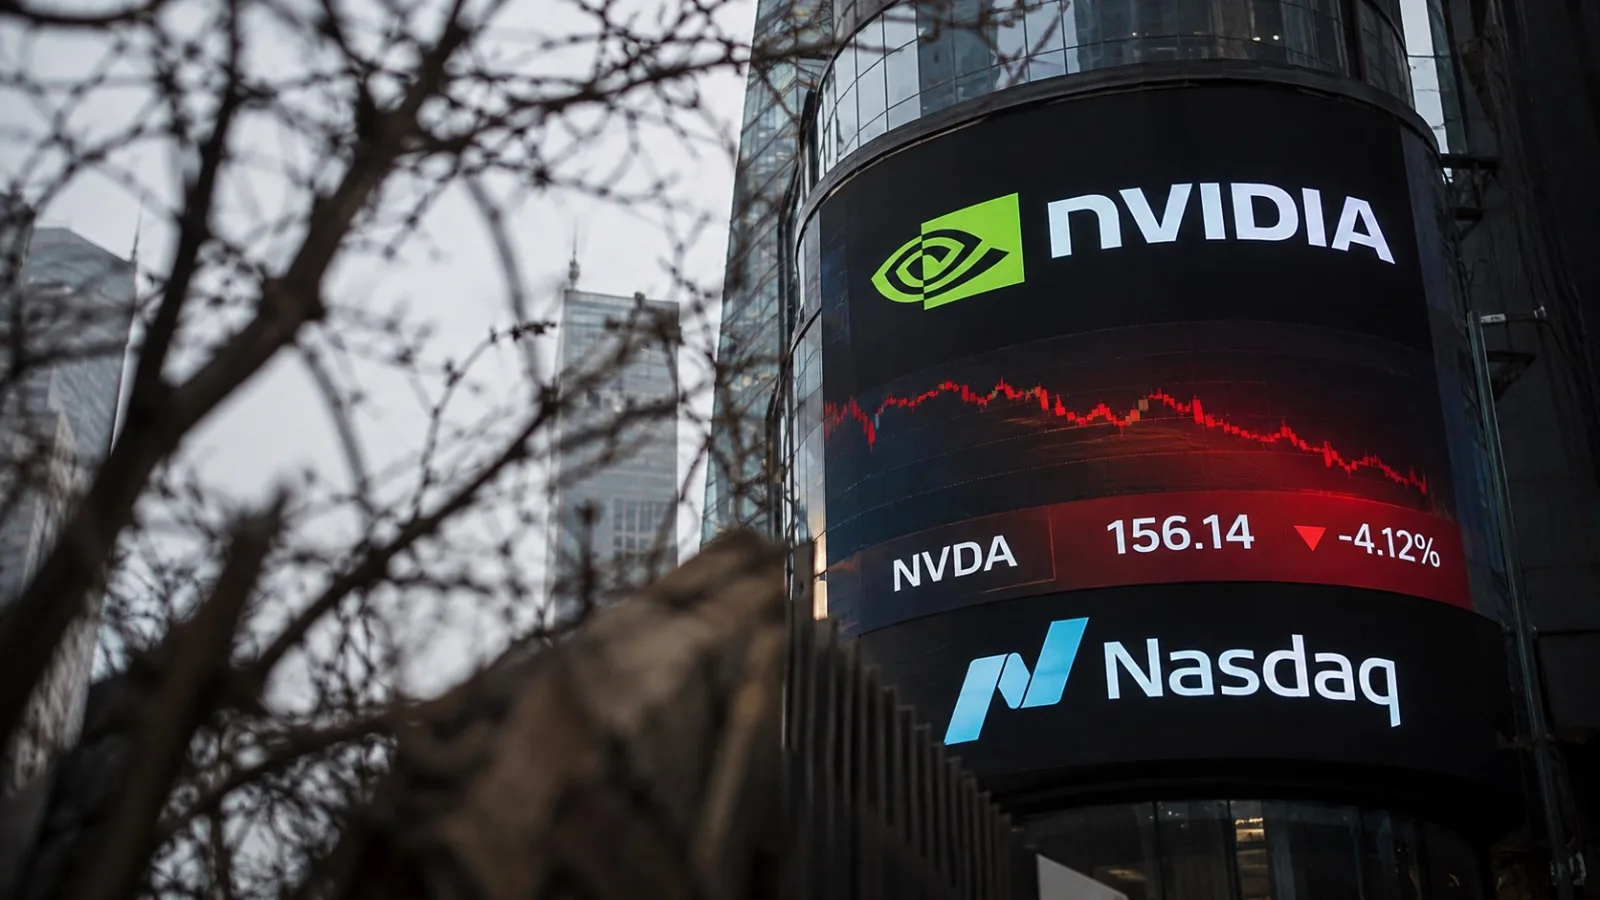
QQQ fell 2.67%, Nvidia 4.12% and SOXX 5.41% on Nov. 16. The biggest danger now may be abandoning your investing rules out of fear or impatience.
The 20-second read
On Nov. 16, QQQ fell 2.67%, Nvidia fell 4.12% and the semiconductor ETF SOXX fell 5.41%. Nvidia is now about 35% below its recent high.
Is it time to sell and run? Or to call this a historic bottom and buy 3x leveraged ETFs such as SOXL and TQQQ?
The biggest thing to guard against now is not the decline itself. It is changing your investing principles out of fear and impatience.
1. Big drops, but not everything is oversold
| Ticker | Nov. 16 close | RSI (daily) | ADX (daily) |
|---|---|---|---|
| QQQ | $661.75 | 37.76 | 30.31 |
| TSLA | $379.74 | 49.46 | 12.93 |
| NVDA | $156.14 | 22.72 | 43.47 |
| SOXX | $141.22 | 37.72 | 31.69 |
Closing prices were checked against public price data. RSI and ADX use the TradingView readings provided.
Nvidia is in the worst shape. An RSI of 22.72 is oversold territory where a bounce can come. But ADX measures the strength of a trend, not its direction. A falling stock paired with a high ADX points to a strong downtrend that is still running.
On Nov. 12, Nvidia fell as low as $148.80 intraday and then rebounded, but it could not hold the gains. Selling may have peaked, but a final bottom has not been confirmed.
2. What has to change for the market to recover
On the readings provided, all four tickers sit below their daily 200-day and weekly 50-week moving averages.
| Ticker | 200-day moving average | Why it matters |
|---|---|---|
| QQQ | $682.44 | Gateway to a medium-term trend recovery |
| TSLA | $382.48 | Test of a short-term recovery |
| NVDA | $204.02 | Large gap between the medium-term trend and the current price |
| SOXX | $160.52 | Confirmation of a recovery in semiconductors |
QQQ dropped to $647.05 on Nov. 5 and bounced to around $690, then slid back to $661.75. That reads less like the start of an uptrend and more like a failed rally inside a downtrend.
The pattern has appeared before. In 2022, rallies came repeatedly, but the decline continued under the weight of tightening. In 2020 and 2024, by contrast, sharp drops were followed by quick recoveries.
3. Nvidia earnings: the reaction matters more than the numbers
Nvidia's earnings are an important variable for the short-term direction. But good results do not necessarily guarantee a higher stock price.
First, watch whether Nvidia can reclaim $163 to $170, then recover to the $176 to $180 zone. At the same time, check whether SOXX and QQQ join the rebound.
If the stock jumps after the report and then gives back most of the gain, it suggests plenty of supply remains. A more convincing signal would be holding the gains for two to three sessions after the report while making higher lows.
4. SOXL and TQQQ: the sweetest and riskiest temptation
TQQQ is designed to deliver 3x the daily return of the Nasdaq-100, and SOXL 3x the daily return of a semiconductor index. They are not built to deliver 3x the cumulative return over long periods.
If the underlying index falls 10% in a day, a 3x leveraged product loses roughly 30% on simple math. Even if the index later returns to its starting price, daily resets and compounding can leave the leveraged ETF short of its original capital.
In a market that swings sharply again and again, you can get the direction right and still earn less than you expected.
Gradually buying shares of quality companies you plan to hold for the long term is a very different investment from using 3x leverage to try to call the bottom.
5. When to consider buying again
The levels below are observation zones from the technical analysis provided. They are not confirmed support lines or price targets.
| Ticker | Low holds | First recovery | Medium-term improvement |
|---|---|---|---|
| QQQ | Around $647 | $670 to $672 | $682 to $685 |
| TSLA | $374 to $376 | $382 to $386 | $392 to $400 |
| NVDA | $148.80 | $163 to $170 | $176 to $180 |
| SOXX | $130 to $134 | $147 to $152 | $158 to $161 |
Reaching a given price is not the whole point. What matters is whether the low holds, whether a broken level turns into support, and whether gains continue on rising volume.
You do not have to wait for every condition. But buying on a held low alone carries a different level of risk than buying after the moving averages are reclaimed. If you do enter, scaling in to match your time horizon and tolerance for losses looks reasonable.
Now is a time to protect capital rather than hurry for profit.
Not buying the bottom is not a failed investment. What matters more is having enough capital and steady judgment when the next uptrend begins.
Be the investor who survives to the next rally, not the one who tries to call the bottom.
Technical observation zones do not guarantee future returns.
- Oversold readings raise the odds of a short-term bounce, but they do not guarantee a bottom. In a strong downtrend, RSI can stay low for a long time.
- You may miss the early gains of a bounce. That can be read as the price of getting evidence that the trend has recovered. Long-horizon investors in the underlying shares can apply a separate rule of buying in stages.
- Better earnings are a positive, but investors' expectations and valuation also matter. You need to watch whether the stock holds its gains after earnings.
- You don't have to catch every rebound. Position size, loss control, and long-term capital preservation can matter more than your entry price.
What to watch