The S&P 500 Barely Fell. Why Did Your Stocks Get Crushed?
Index numbers and brokerage accounts can tell different stories. In an AI-driven pullback, breadth is the first thing to check, before direction.

The S&P 500 is down only a few percent from its high, yet the tech stocks in your account are down by double digits. That is not index manipulation, and it is not necessarily a sign of a market crash. It happens because two different numbers are being compared.
All 500 stocks do not get an equal vote
The S&P 500 holds large US companies, but each one affects the index differently. A 1% move in a company with a large float-adjusted market cap moves the index more than a 1% move in a smaller weight. So when many stocks struggle but a few mega-caps are strong, the index can look solid. The reverse can also happen.
Suppose a group of large stocks making up 30% of the index rises 10%, while the other 70% falls 2%. All else equal, the index gains about 1.6%. This is a hypothetical calculation meant to show the structure, not an actual market return.
- Large stocks, 30% x +10%: +3.0 points
- The other 70% x -2%: -1.4 points
- Index total: +1.6%
How to look under the surface
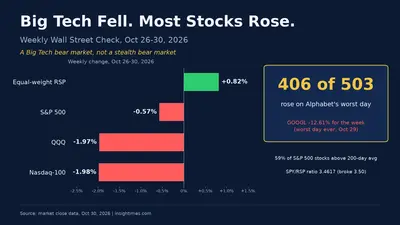
On Oct. 30, 2026, the S&P 500 fell 1.82% from the previous day. The Nasdaq Composite dropped 2.86%, and the Russell 2000 slid 1.66%. Even on the same day, the size of the hit varied by index. On Oct. 29, by contrast, the S&P 500 fell but advancing stocks outnumbered decliners, and the Russell 2000 rose. One day's index move is not enough to define the direction of the whole market.
Market breadth shows how many stocks are actually taking part in a move. The gauges to check are:
- the number of advancing versus declining stocks
- the share of stocks above their 200-day moving average
- the number of 52-week highs and lows
When these indicators disagree, it is better not to draw a conclusion from any single one.
Be careful, too, with statements such as "60% of S&P 500 stocks are in a bear market." They may leave out the time period and the definition. The share of stocks that have fallen 20% or more at some point in the past is a different statistic from the share that are 20% or more below their 52-week highs today. On the Oct. 30 close, one tracker put the latter at about 32%. Figures can vary with the constituents and the price-adjustment method.
SPY and RSP: the same 500 companies, a different experience
| SPY / VOO approach | RSP approach | |
|---|---|---|
| Weighting | Proportional to market cap | Generally equal weight |
| Feature | Mega-caps have large influence | Relatively even spread |
| Can work well when | Giant companies lead the rally | More stocks join the advance |
| Caveats | Concentrated in top holdings | Periodic rebalancing, relatively more mid- and small-cap exposure |
Equal weight is not a magic shield. If the mega-caps leading a bull market keep out in front, cap-weighted ETFs can deliver higher returns. RSP cannot avoid a market decline either. The point is not to guess which ETF will rise and when. It is to understand which companies and factors your own portfolio is leaning on.
Insight Times Editorial Desk